
Introducing Google Analytics for beginners! Specifically, Google Analytics 4 (GA4), the younger, cooler version of the old Universal Analytics (UA). And with GA4 replacing UA completely from July 2023, online business owners are pushed back into learning mode again. And if you’re totally new to both of these platforms, don’t worry because Sendle’s got you covered.
Need help growing your online presence? Sendle's SEO team’s got your back, with Google Analytics for beginners—your basic guide to growing your online presence through this versatile digital marketing tool.
If you’re a small business owner who’s had an online shop for a while now, you probably already know that it’s not enough to just have a website. At the same time, we’ve seen brick and mortar stores shut down or suffer a lot during the pandemic.
In this digital age, you have to know how to navigate your way through the world wide web in order to adapt. Likewise, those with both online and physical stores are quickly learning that growing an online presence can generate way more sales than placing signs outside your brick and mortar store.
Through digital marketing, you’re able to advertise your products or services to people in places you otherwise wouldn’t have been able to reach. That’s why it’s important to utilize Google Analytics for website performance.
Learn the basics of Google Analytics and what it can do for your business
What is Google Analytics?
Google Analytics is a web analytics service within the Google Marketing Platform that tracks and reports website performance—from traffic, click-through rates, to conversions and search engine ranking. And, the reason this tool is so powerful is because Google is undoubtedly the most popular search engine, with the capacity to track and analyze user behavior across search results and even within your website.
Google Analytics 4 replaces Universal Analytics
Just like the Google Core Updates, Google Analytics also updates to keep up with the ever changing digital landscape. Now, think of Google Analytics 4 (GA4) as the younger, more modern sibling of Universal Analytics (UA).
And if you’re acquainted with Universal Analytics, prepare for a new and improved dashboard in GA4! You’ll have to upgrade to GA4 sooner or later to properly migrate all your data because UA will become obsolete by 1 July 2023. You’ll still be able to view data on that same platform, but new data will only flow into Google Analytics 4 properties.
How can you use Google Analytics 4 for your eCommerce business?
The benefit of using Google Analytics is to provide small businesses with valuable customer insights that can improve your marketing efforts. Matched with your customer research techniques, you’ll be able to create a holistic customer persona online and offline.
The platform also helps you measure how effective your online efforts are in leading to your eCommerce business objectives through metrics. You can even customize reports to compare your website performance in terms of campaigns, medium (ads, email, organic search, etc.), or even time (yearly, quarterly, weekly, etc.).
Top Google Analytics 4 metrics to know
Once you have your dashboard, you’ll see that there are way too many Google Analytics 4 dimensions and metrics that appear in your reports, explorations, and in the audience segment builders. Let’s define the most useful metrics to help Sendle’s small business owners.
1. Page views
The number of mobile app screens or pages within your website that your users saw or landed on. Repeated views of a single screen or page are counted by Google Analytics 4. Meanwhile, views per user is the average number of pages a user visits on your website.
A low number of views per user indicates that your users aren’t exploring other pages on your website. Ideally, your website is presented well enough that it keeps users wanting to learn more by navigating through different pages on your site. A good example of keeping your page views and views per user up is by recommending related blogs at the end of each blog page.
This isn’t to be confused with sessions. A single session often contains multiple activities, such as page views, events, or transactions. Then, it’s capped either by exiting the website or by a 30 minute period of user inactivity.
2. Engagement rate
The engagement rate is simply the percentage of sessions that were engaged sessions.
Engaged sessions is the number of sessions that lasted 10 seconds or longer, or had 1 or more conversion events, or 2 or more page or screen views. This helps you distinguish between users who intentionally visited your website or interacted with it, and those who either just chanced upon your website or immediately did not see what they were looking for. In short, this number represents the users who expressed interest in your product or service.
If you’re able to target the right audience yet have a low engagement rate, it’s a sign that your product or service isn’t being marketed well enough on your website. In this case, apply customer research insights to know exactly what your target audience is looking for.
3. Average session duration
The average session duration tells you how long users stay on your website. It counts the total hours, minutes, and seconds of user sessions—starting from the moment they land on your website up until they exit the website or the session expires. This includes the time when your website or application is running in the background.
On a smaller scale, the average time on page counts the total hours, minutes, and seconds users spend on a particular page. Looking at the pages with the highest views and average time on page helps you understand where in your website your users are spending most of their time. Likewise, listing the pages that are performing lower in these metrics signals you that these are the ones that need tweaking, updating or just more engaging content.
4. Session conversion rate
Conversion is the goal of every user journey, and Google Analytics 4 allows you to set what conversion means for your business website. This could be a purchase, a game level completion, or app scroll activity. Whatever it is, setting your conversions lets Google know that these are your measures of success. You can even add a monetary value to each conversion event!
Essentially, the session conversion rate is the percentage of sessions that are converted. This metric is calculated as the number of sessions in which a conversion happened divided by the total number of sessions.
It’s not enough to have a high engagement rate if your session conversion rate doesn’t follow. As a small business owner, you want to convert your leads into conversions, or interested users into actual buyers.
5. Session source / medium
The session source / medium tells you where your website visitors came from.
- Session Source identifies the publisher or inventory source from which traffic originated, such as Google, YouTube, and Gmail.
- Session Medium is the method for acquiring users to your website or application. Examples include:
- affiliate: users who click a link through an affiliate program
- cpc (short for cost-per-click): users who click a paid advertisement
- email: users who click a link in an email marketing campaign
- organic: users who click a link from a search engine
- referral: users who click a link on a website (e.g., a link in a Sendle blog directing to your website)
- (none): direct traffic
It’s important to know how your users landed on your website. That way, you can direct your efforts to the right platforms instead of wasting your advertising budget on platforms that don’t attract your target audience.
6. Bounce rate
The percentage of sessions that were not engaged sessions. This percentage represents the users who triggered only one event from the Google Analytics server, without triggering another, then bounced off your website. Typically, these are the users who contributed to one page view and then exited your website.
Your goal as a small business owner is to keep the bounce rate low by creating high quality and relevant content that would make your users stay, explore, and engage with your pages. When you have an unoptimized page, even if it garnered high views, if the bounce rate is high, that means your users took one look and left without clicking a button (no conversion) or exploring other pages on your site.
How to understand the Google Analytics dashboard
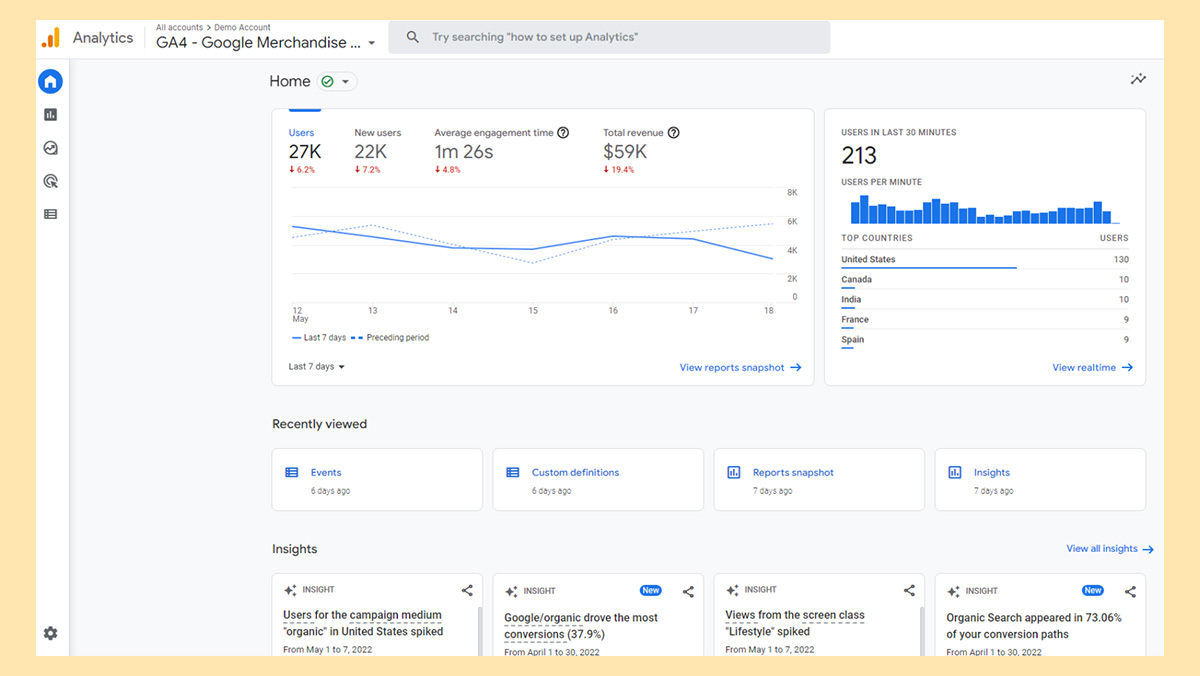
Looks intimidating? Don’t worry, we’ll cover all the basics in this blog | Image by NP Digital
You’ll see the above mentioned metrics all over the dashboard, across many different charts. Let’s go through each tab on the menu:
- The Home tab is the default tab on your dashboard. You’ll find a summary of insights, including a live count of users visiting your site within the last 30 minutes!
- The Reports tab houses all the reports Google finds useful for you to see, as well as those that you customized for your small business. Under this tab, you’ll find the following:
- Reports snapshot of highlighted metrics.
- Real time overview of metrics within the last 30 minutes.
- Life cycle of users from acquisition and engagement to monetization and retention.
- User demographics and their tech or device details.
- The Explorations tab is your avenue for highly customizable data reporting. Here, you can choose the dimensions, metrics, and data you want to see from anywhere on your website. You can even filter groups of web content down to the word usage or URL!
- The Advertising tab focuses on where your conversions came from and at which point of the user journey they were triggered.
- The Configure tab is where you can create events and conversions, and qualify them based on your small business success measures. As your business grows, you can modify these settings to keep up the pace.
Having a hard time interpreting charts? On each page, you’ll see a couple of ✨sparkle✨ symbols around. Upon clicking, you’ll be presented with Google bot’s insights of each chart generated—isn’t that helpful!

One of the most impactful benefits of using online monitoring tools like Google Analytics 4 is the ability to understand large amounts of data, so that you can report better.
What you can do with Google Analytics 4
There are a lot of digital marketing tools out there, but a lot of digital marketing specialists would agree that Google Analytics is one of the essential platforms to invest in if you have an online store or eCommerce website!
Is Google Analytics free?
Google Analytics has two price plans: Google Analytics and Google Analytics 360. If you own a small business, you can start with Google Analytics, which is the free plan. Once your business grows and you start to monitor more metrics and produce more complex reports, we recommend the Google Analytics 360 monthly subscription.
Google Tools that integrate with Google Analytics
Inputting data manually for reports? Let Google do that for you by integrating seamlessly with other Google solutions!
- Google Ads
- Display & Video 360
- Search Ads 360
- Google Cloud
- Salesforce Marketing Cloud Integration
- Google Ad Manager
- Google AdMob
- Google Play
- Google Search Console
Benefits of Google Analytics to small business owners
Google Analytics takes pride in making data work for you. As your business’ data collector, it’s able to apply machine learning to understand your customers’ behaviors and provide meaningful insights. Having all the data recorded into reports also makes it easier for you to make your own insights to better understand your customers.
No matter how long you've been in your industry, what worked a year ago or even just last week may not work for your target market today. That’s why it’s important to constantly monitor whether your marketing efforts have been working or not. Google Analytics provides not just this, but so much more, so that you get better results and ROI from your marketing.
